Grain Transportation Update: March 2020
This article has been reprinted from the March 19 USDA Grain Transportation Report.
Most movement and price indicators—across all modes—have been down so far in 2020, compared to 2019 and historical averages.
Grain exports are down, contributing to low grain shipments for railroads and barges—the predominant U.S. modes that supply export markets.
Low demand has also led to generally low freight rates for rail, barge, and ocean.
According to USDA’s latest World Agricultural Supply and Demand Estimates (WASDE) report, domestic use of corn, soybeans, and wheat is up slightly from last year, which points to steady or higher demand for truck transportation.
Rail Carloads of Grain Down in 2020
In aggregate, rail freight volumes are down so far this year compared to 2019.
According to the Association of American Railroads (AAR), total YTD carload traffic (including grain) originated by U.S. Class I railroads is down 6 percent from last year, and intermodal traffic is down 8 percent.
Grain has contributed to the low volumes, down 8 percent YTD.
However, rail carloads of grain have ticked up in recent weeks, after a weekly low of 18,325 carloads for the week ending February 15.
Positive signs for other carload traffic include chemicals (up 3 percent YTD from 2019) and metallic ores (up 10 percent).
Bids for grain shuttle service in the secondary auction markets have been well below average in 2020.
Average bids/offers for delivery of railcars in January began trading in November at around −$100 per car, before falling to about −$450 by early January.
February bids/offers averaged −$113 per car, down more than $600 per car from the 3-year average.
Trades for delivery of railcars in March have hovered around −$100 per car for several weeks, down substantially from the prior 3-year average (GTR fig. 4).
Grain rail service has been strong throughout the quarter, in part because of low demand for rail transportation and less network congestion.
According to rail service metrics from the Surface Transportation Board, average weekly grain train speeds have fallen since January but at a typical rate for the time of the year.
So far, weekly grain train speeds in March have averaged 23.4 miles per hour, 6 percent higher than March 2019.
Terminal dwell times have followed a similar pattern, rising since January—likely due to winter weather conditions—but remaining below recent years.
Grain origin dwells times are also well below prior years, down 45 percent from the prior 3-year average for March.
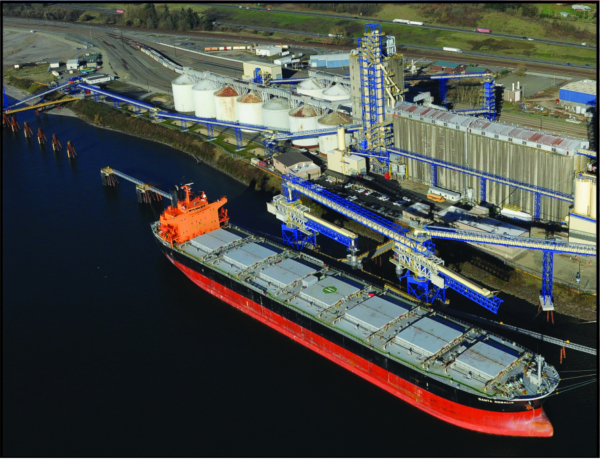
Low Demand and Highwater Challenge Early 2020 Barge Shipping
The volume of barged grain in 8 of the first 10 weeks of 2020 exceeded that in the equivalent week of 2019.
However, 2019 had historically bad weather that caused severe navigation disruptions, including complete outages of portions of the Mississippi River system. Compared to the 4-year average, 2020 shipment volumes were significantly down.
In addition, for all stretches of the river system that USDA data cover, spot barge shipping rates have reached their lowest point since August 2017.
After a slight uptick earlier in the year, the rates slowly trended down.
Several notable highwater events drove these trends.
The Ohio River and several points on the lower Mississippi River reached severe flood stage.
Flooding also caused delays to planned dredging on the Arkansas River.
Navigation challenges affect barge supply through cost overruns, lower productivity, and difficulty moving barges up-river.
Flooding can also stymie elevator operation, lowering barge demand by blocking river access for some grain.
Transportation News
- NGFA Urges STB to Preserve Competition in CN-IANR Merger
- CPKC, Shipper Urge STB to Resolve Texas Trackage Rights Dispute
- Diesel Price Drops for 3 Consecutive Weeks
- Container Shipping Approaches Maximum Capacity
- Panama Canal Increases Daily Transit Slots
- Major Canadian Railways Continue to Have Trouble Delivering Grain: Ag Transport Coalition
- Georgia Allots $6 Million to Brunswick Harbor Improvements
- Ports of Indiana Hires General Counsel, Promotes Director, Welcomes Returning Mt. Vernon Port Official
- The Georgia Ports Authority's January Rail Cargo Jumps 27 Percent
- CPKC Rail Awards Viterra Weyburn Terminal as Elevator of the Year