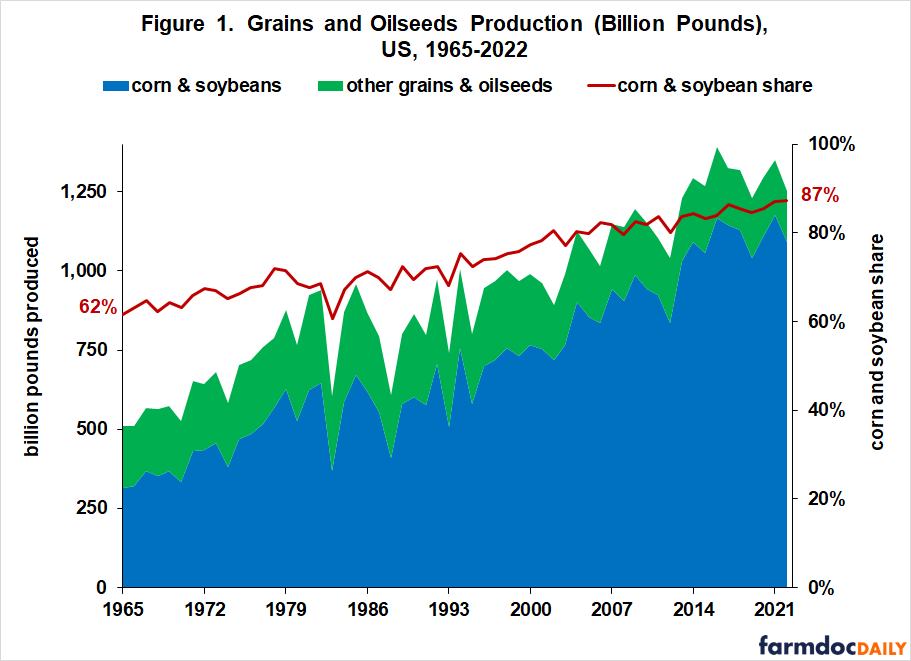
Corn and soybeans currently account for 87% of U.S. production of grains and oilseeds. Moreover, since the mid-1990s, one-quarter of the increase in U.S. production of grains and oilseeds can be attributed to the increasing concentration in corn and soybeans.
Given that U.S. grain and oilseed acres have been range bound between 225 and 250 million acres since 1985, the increasing concentration in corn and soybeans can be seen as an outcome of the private market balancing supply and demand to maintain US production of grains and oilseeds.
Data
Data were obtained from the Quick Stats database (US Department of Agriculture, National Agricultural Statistics Service) for U.S. produced grains and oilseeds during the 1965/66 (hereafter, first year is used) — 2022 crop years. The initial year was chosen to be near the end of the period of fixed price supports managed by government supply control and public stock programs.
Data for 2022 are estimates as of mid-August 2023. Grains and oilseeds in this analysis are corn, sorghum, barley, oats, wheat, rice, rye, soybeans, canola, sunflowers, peanuts, cottonseed, flaxseed, mustard, rapeseed, and safflower. Production was converted into pounds, then summed across these crops.
Production
Corn and soybean share of U.S. grain and oilseed production increased from 62% in 1965 to 87% in 2022 (see Figure 1). Average annual increase over the 58 years was 0.44 percentage point per year. Regression analysis finds that the annual rate of increase has increased slightly over time by 0.00003 percentage point per year (see Data Note 1 for the regression equation).
Figure 1. Image courtesy of farmdoc daily
Acres
Percentage point increase in corn–soybean share of harvested grain and oilseed acres from 47% in 1965 to 74% in 2022 (see Figure 2) is similar to the percentage point increase in corn-soybean share of production (see Figure 1).
Since 1985, harvested U.S. grain and oilseed acres have not trended up or down, varying from 225 to 250 million acres per year (see Figure 2).
In particular, harvested acres were stable during the crop prosperity of 2007-2013. During the crop prosperity of the 1970s, they increased by 33%, from 215 million in 1972 to a peak of 287 million in 1981.
Figure 2. Image courtesy of farmdoc daily
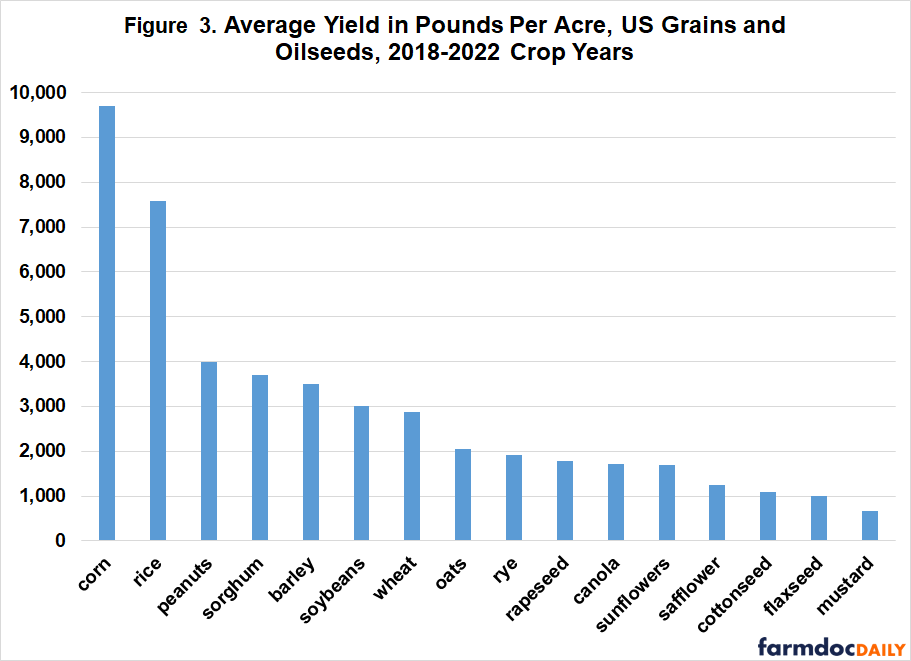
Yield
Corn-soybean share is notably higher for production than harvested acres. Yield is the reason. Using data for 2018-2022, corn has the highest yield and soybeans the sixth highest yield among the 16 grains and oilseeds in this study (see Figure 3). Corn’s yield was 28% higher than the yield of the next highest crop, rice (9,698 vs. 7,575 pounds per acre).

Figure 3. Image courtesy of farmdoc daily
Corn-Soybean Share and Grain and Oilseed Output
It is conventional to think of changes in crop production as resulting from changes in yield and harvested land. This breakout holds arithmetically for an individual crop, but not necessarily for a set of crops, such as grains and oilseeds. Acres can shift among crops in the set, resulting in more or less production relative to no shift in acres.
The impact of shifting acres among grain and oilseed crops upon total U.S. grain and oilseed production is calculated for two time periods: 1965-1969 through 1991-1995 and 1991-1995 through 2018-2022. These two periods have similar lengths. Their beginning and ending dates are:
- a period (1965-1969) near the end of fixed price supports managed by government supply control and public stock programs,
- a period (1991-1995) at the end of government management of supply using voluntary land retirement programs, and
- the most recent five crop years with complete data (2018-2022).
In contrast to the first period, the share of harvested principal crop acres accounted for by the top two crops, corn and soybeans, steadily increased in the second period.
The shift in share of harvested acres among grains and oilseeds resulted in production that was 3% higher in 1991-1995 than if the share had remained the same as in 1965-1969 (see Figure 4).
In contrast, during the second period the shift in share of acres accounted for 25% of the increase in grain and oilseed production. While not the only reason, a key reason was the change in corn’s share of harvested grain and oilseed acres. In the first period, corn’s share increased slightly, from 30.1% in 1965-1969 to 31.3% in 1991-1995.
In the second period, it rose notably to 37.6% in 2018-2022. Soybean’s share rose from 18.0% to 24.9% to 35.5% in the three sequential five-year periods. Besides corn and soybeans, only canola and mustard also had a higher share of total harvested grain and oilseeds acre in each succeeding period.
Canola and mustard account for slightly less than 1% of current grain and oilseed acres. While not totally accurate, the shift in grain and oilseed acres to corn and soybeans has accounted for a quarter of the increase in total U.S. grain and oilseed output during the 21st Century.
Calculation of the contribution of the shift in acres to total U.S. grain and oilseed production is discussed in Data Note 2.

Figure 4. Image courtesy of farmdoc daily
Discussion
U.S. grain and oilseed acres have been range bound between 225 and 250 million acres since 1985. Several factors are likely involved in creating what has become an apparent cap on US grain and oilseed acres.
One factor is likely the restrictions that date to the 1985 farm bill on the conversion of highly erodible land into new cropland without an approved conservation plan for the new cropland (so-called sodbuster provision) and conversion of wetlands, specifically hydric soils, into new cropland (so-called swampbuster provision). Such conversions can lead to the loss of some farm safety net benefits.
Whatever its cause, the lack of new acres puts pressure on raising production by other means to meet increasing demand.
One option is higher yields, but the rate of increase in yields is not keeping pace with the rate of increase in consumption for both the U.S. and world.
Another option is to shift crops among existing acres to maximize output. This study finds that this option has accounted for about 25% of the increase in U.S. production of grains and oilseeds during the 21st Century.
Thus, without the shift in grain and oilseed acres to corn and soybeans, U.S. exports and/or domestic consumption of grains and oilseeds would be notability smaller in 2022.
The increasing concentration of U.S. crops in corn and soybeans can be seen as the private market seeking to increase U.S. production of grains and oilseeds.
However, land planted to corn and soybeans is limited by agro climate considerations, such as rainfall, and ultimately because corn and soybeans cannot exceed 100% of grain and oilseed acres.
Other options are to change U.S. cropland conversion policy, which seems unlikely at present; increase multiple cropping of U.S. land; and reduce U.S. exports to meet the growth in domestic U.S. consumption as acres expand outside the U.S.
Because new land, including multiple-cropped land, enters production in the U.S. and the rest of the world only when a profit incentive exists, upward pressure on crop and food prices appears likely to be more common in the future than in the past.
Carl Zulauf, Department of Agricultural, Environmental and Development Economics, Ohio State University
Gary Schnitkey, Nick Paulson, and Joana Colussi, Department of Agricultural and Consumer Economics, University of Illinois
For more information, visit farmdocdaily.illinois.edu.
Data Notes
- Estimated time trend equation for corn-soybean share of grain and oilseed production:
corn-soybean production share = 62.8% +0.00279 (time) + 0.00003 (time squared); R2 = 93%
Time is measured as a count variable starting with 1 for 1965. Share is measured as a percent.
- Change in production due to the change corn-soybean share is calculated by comparing (average total production of the 16 grains and oilseeds combined for the last five years of a period) and (sum for the 16 crops of the product of [average yield in pounds per acre for a crop in the last five years of the period times average harvested total U.S. grain and oilseed acres in the last five years times the crop’s average share of all grain and oilseed harvested acres in the first five years of the period]) to (average total production of the 16 grains and oilseeds combined for the first five years of the period).
Data Sources and References
US Department of Agriculture, National Agricultural Statistics Service. August 2023. QuickStats.
Zulauf, C. “US Feed Grain, Oilseed, and Food Grain Land since 1980.” farmdoc daily (12):176, Department of Agricultural and Consumer Economics, University of Illinois at Urbana-Champaign, November 21, 2022.
Zulauf, C. “The World’s Increasing Need for Cropped Land.” farmdoc daily (12):173, Department of Agricultural and Consumer Economics, University of Illinois at Urbana-Champaign, November 16, 2022.
Zulauf, C., J. Colussi, G. Schnitkey and N. Paulson. “Concentration of US Principal Crop Acres in Corn and Soybeans.” farmdoc daily (13):166, Department of Agricultural and Consumer Economics, University of Illinois at Urbana-Champaign, September 13, 2023.